- Joined
- Aug 19, 2012
- Messages
- 126
- Points
- 18
The 'w' and 'cat /proc/loadaverage' gives static results.
root@Quantum-Computer:~$ w
11:32:59 up 1:27, 1 user, load average: 1.30, 0.66, 0.47
USER TTY FROM LOGIN@ IDLE JCPU PCPU WHAT
root :0 :0 10:07 ?xdm? 5:28 0.01s /usr/lib/gdm3/g
----------------------------------------------------------------------------------------------------------
root@Quantum-Computer:~$ cat /proc/loadavg
1.05 0.65 0.47 2/1002 17905
root@Quantum-Computer:~$
----------------------------------------------------------------------------------------------------------
For dynamic and more informative results you can use 'top -c' .
root@Quantum-Computer:~$ top -c
top - 11:50:26 up 1:44, 1 user, load average: 0.77, 0.63, 0.65
Tasks: 290 total, 2 running, 235 sleeping, 0 stopped, 0 zombie
%Cpu(s): 8.5 us, 2.4 sy, 0.0 ni, 89.2 id, 0.0 wa, 0.0 hi, 0.0 si, 0.0 st
KiB Mem : 3935120 total, 210620 free, 2286616 used, 1437884 buff/cache
KiB Swap: 0 total, 0 free, 0 used. 1051160 avail Mem
PID USER PR NI VIRT RES SHR S %CPU %MEM TIME+ COMMAND
16962 root 20 0 2731864 257116 125972 R 18.5 6.5 5:14.55 /usr/lib/firefox/firefox -contentproc -childID 7 -isForBrowser -prefsLen+
16571 root 20 0 3744412 343672 148292 S 9.9 8.7 8:53.16 /usr/lib/firefox/firefox -new-window
2860 root 20 0 3909860 215352 96824 S 5.3 5.5 3:21.84 /usr/bin/gnome-shell
2703 root 20 0 785180 72160 55716 S 5.0 1.8 2:30.12 /usr/lib/xorg/Xorg vt2 -displayfd 3 -auth /run/user/1000/gdm/Xauthority +
17881 root 20 0 728244 37076 27796 S 4.0 0.9 0:03.06 /usr/lib/gnome-terminal/gnome-terminal-server
2883 root 9 -11 2914508 15604 11524 S 1.7 0.4 4:06.27 /usr/bin/pulseaudio --start --log-target=syslog
- Joined
- May 11, 2020
- Messages
- 11
- Points
- 1

iftop - A Real Time Linux Network Bandwidth Monitoring Tool
- Joined
- Jul 7, 2016
- Messages
- 614
- Points
- 28
Yup, you can!!
The 'w' and 'cat /proc/loadaverage' gives static results.
root@Quantum-Computer:~$ w
11:32:59 up 1:27, 1 user, load average: 1.30, 0.66, 0.47
USER TTY FROM LOGIN@ IDLE JCPU PCPU WHAT
root :0 :0 10:07 ?xdm? 5:28 0.01s /usr/lib/gdm3/g
----------------------------------------------------------------------------------------------------------
root@Quantum-Computer:~$ cat /proc/loadavg
1.05 0.65 0.47 2/1002 17905
root@Quantum-Computer:~$
----------------------------------------------------------------------------------------------------------
For dynamic and more informative results you can use 'top -c' .
root@Quantum-Computer:~$ top -c
top - 11:50:26 up 1:44, 1 user, load average: 0.77, 0.63, 0.65
Tasks: 290 total, 2 running, 235 sleeping, 0 stopped, 0 zombie
%Cpu(s): 8.5 us, 2.4 sy, 0.0 ni, 89.2 id, 0.0 wa, 0.0 hi, 0.0 si, 0.0 st
KiB Mem : 3935120 total, 210620 free, 2286616 used, 1437884 buff/cache
KiB Swap: 0 total, 0 free, 0 used. 1051160 avail Mem
PID USER PR NI VIRT RES SHR S %CPU %MEM TIME+ COMMAND
16962 root 20 0 2731864 257116 125972 R 18.5 6.5 5:14.55 /usr/lib/firefox/firefox -contentproc -childID 7 -isForBrowser -prefsLen+
16571 root 20 0 3744412 343672 148292 S 9.9 8.7 8:53.16 /usr/lib/firefox/firefox -new-window
2860 root 20 0 3909860 215352 96824 S 5.3 5.5 3:21.84 /usr/bin/gnome-shell
2703 root 20 0 785180 72160 55716 S 5.0 1.8 2:30.12 /usr/lib/xorg/Xorg vt2 -displayfd 3 -auth /run/user/1000/gdm/Xauthority +
17881 root 20 0 728244 37076 27796 S 4.0 0.9 0:03.06 /usr/lib/gnome-terminal/gnome-terminal-server
2883 root 9 -11 2914508 15604 11524 S 1.7 0.4 4:06.27 /usr/bin/pulseaudio --start --log-target=syslog
Both are good man and I have not ever tried them, thanks for sharing, I will try to install both and see how my server load average is.Install network monitoring in your linux OS via putty

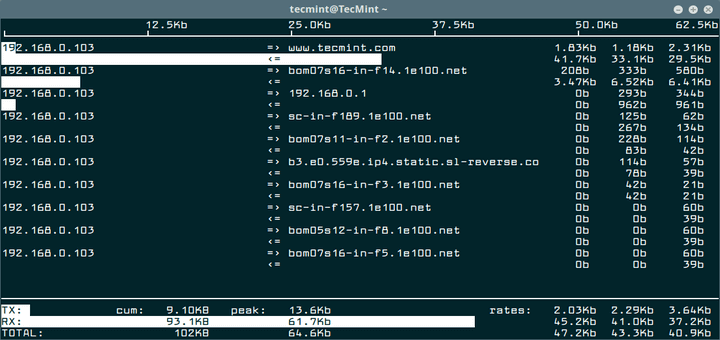
iftop - A Real Time Linux Network Bandwidth Monitoring Tool
iftop is a real time console-based Linux network bandwidth monitoring tool that shows updated list of network usage bandwidth every 2, 10 and 40 seconds.www.tecmint.com
- Replies
- 0
- Views
- 2,422
- Replies
- 9
- Views
- 16,993
- Replies
- 24
- Views
- 13,008
- Replies
- 2
- Views
- 6,035
- Replies
- 2
- Views
- 2,909
- Replies
- 8
- Views
- 8,554
- Replies
- 9
- Views
- 6,544
- Replies
- 2
- Views
- 3,072
- Replies
- 0
- Views
- 5,913
- Replies
- 15
- Views
- 11,515
- Replies
- 10
- Views
- 10,719
Latest Hosting OffersNew Reviews
-
Latest hosting offers
-
Web Hosting Offers / iWebFusion.net -KVM VPS - SPECIAL OFFER-24*7*365 Live Chat SupportUSA VPS
- Vanessa
- Updated:
-
Hostaddon VPS/VDS | EU/US/ASIA | 25/10/2/1 Gbps | SSD NVMe | Upto 50% Off | Storage | DMCA IgnoreUnmetered 1, 10, 25 Gbps Unmetered VPS Hosting
- HostAddon
- Updated:
-
Hostaddon - EU/US/ASIA | 1Gbit/10Gbit Unmetered Servers | Start @$14.99 | Additional 10% OffPremium Hardware @ Affordable prices
- HostAddon
- Updated:
-
About Us
ForumWeb.Hosting is a web hosting forum where you’ll find in-depth discussions and resources to help you find the best hosting providers for your websites or how to manage your hosting whether you are new or experienced. You’ll find it all here. With topics ranging from web hosting, internet marketing, search engine optimization, social networking, make money online, affiliate marketing as well as hands-on technical support for web design, programming and more. We are a growing community of like-minded people that is keen to help and support each other with ambitions and online endeavors. Learn and grow, make friends and contacts for life.
Discussion
Advertising
Community
The world's smartest hosting providers come here to discuss & share what's trending in the web hosting world!


