Hi David,
Thanks for your question.
Method #1:
One method is to see your past bandwidth usage for a particular server. For example if you see a large spike then that most likely is malicious request.
Method #2:
Check your server load graph. Do you see a spike when you suspected you had a DOS or DDOS attack? If you see a spike that is way beyond normal maybe even reaching critical levels that means it is probably a DDOS or DOS attack. Please keep in mind server load can be spiked by many normal things besides an attack
Checking your server load during a suspected attack is also a good thing while you work on mitigation. To check your current server load use the following:
* grep processor /proc/cpuinfo | wc -l
* uptime
Now in terms of technical assuming you are running a Linux based server you can do the following:
Method #3 (Check DDOS Based on Number of IP's That Got Hit):
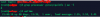
Within a DDOS attack it is generally required a form of connection to your server, it is always possible to check what IP's are hitting your server the most. Take a look at what IP has the highest number to the left if its anything over 200-500 then I would take a look closely to see if it continues to get hit and if so I would begin the mitigation of blocking the specific IP. To check the most used IP's use the following command:
*netstat -ntu|awk '{print $5}'|cut -d: -f1 -s|sort|uniq -c|sort -nk1 -r
*netstat -ntu|awk '{print $5}'|cut -d: -f1 -s |cut -f1,2 -d'.'|sed 's/$/.0.0/'|sort|uniq -c|sort -nk1 -r
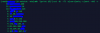 Brute Force Attack Check:
A brute force attack is an attack that consist of an individual who submits many passwords or passphrases to your server. The
goal for a brute force attack is to gain access to your server or account using one of the many passwords submitted in a given
time period. To check for a brute force attack please use the following command:
*netstat -plan|grep :80|awk {'print $5'}|cut -d: -f 1|sort|uniq -c|sort -n
With a cPanel based server here are some good logs to take a look at and to keep for reference:> Incoming and outgoing mail log | /var/log/exim_mainlog – Find out what happened to an email sent to an outside server, or one that came into this server.
>
POP or IMAP login/transaction records = /var/log/exim_mainlog – Find out what happened to an email sent to an outside server, or one that came into this server.
>
POP or IMAP login/transaction records = /var/log/maillog – Find out when a mailbox was accessed, from which IP, and if it was successful.
>
Anti-spam logs (eg. SpamAssassin) = /var/log/maillog – Find out if a mail was tagged as spam, and the reason for it.
>
Mails rejected by Exim SMTP server = /var/log/exim_rejectlog – Find out if a mail was rejected at connection level due to an Exim security policy.
>
SMTP/POP/IMAP server crash logs = /var/log/messages, /var/log/maillog, /var/log/exim_paniclog – Find out why Exim/Courier/Dovecot servers crashed.
>
Mailman logs = /usr/local/cpanel/3rdparty/mailmain/logs/* – Logs under this directory shows what happened to various mailing lists.
>
RoundCube delivery and error logs = /var/cpanel/roundcube/log/* – Logs under this directory shows mail delivery details and RoundCube access errors.
>
Horde error logs = /var/cpanel/horde/log/* – Logs under this directory show Horde errors.
>
SquirrelMail logs = /var/cpanel/squirrelmail/* – Logs related to SquirrelMail errors.
>
Web site access logs = /usr/local/apache/domlogs/[DOMAIN_NAME] – Find out which IP accessed the site at a given time, and the status of access.
>
Web site and server error log = /usr/local/apache/logs/error_log – Details of error returned in the web site.
>
Mod Security error log = /usr/local/apache/logs/modsec_audit.log – Details of the mod_security deny error.
>
SuPHP audit log = /usr/local/apache/logs/suphp_log – Find out under which user ownership a script was executed.
>
Apache restarts through cPanel/WHM = /usr/local/cpanel/logs/safeapacherestart_log – Find out at what all times Apache was restarted through WHM.
>
File upload logs = /usr/local/apache/domlogs/ftp.[DOMAIN_NAME]-ftp_log – Find out which IP uploaded the files, under which user ownership, and status of upload.
I hope this has helped in some way if you have any questions feel free to ask me I am happy to help you out. Please note for the security of our systems and servers some of the IP's and server names have blue over them in a real world check in a command line or CLI you will not see the blue. All of this is something your current web hosting or server administrator should be able to help you on that is if you are running some kind of
Fully Managed and Supported Server.
Hope your DOS or DDOS is no longer an issue!
==========================
Happy Hosting!
Mario Cano